After hearing from Minneapolis families, schools, and community leaders, we know that Minneapolis families think about many factors when choosing a school: Will my student be safe? Will they be treated fairly? Will they learn?
The Minneapolis School Finder Rating helps families answer these questions. We use public data to communicate student outcomes. We consider how schools meet the needs of students based on their background.
We also know that not all data can be measured. There is no publicly available number that tells us how families feel welcome in a school or how each student’s unique identity is embraced by their teachers. This is why we work with schools to create their school profiles. Schools describe their academic program, culture, values, & more. You should look at a school’s entire profile when deciding if this school could be a good fit for your student.
We look at three performance areas for our rating:
- Academics: Number of students on grade level, on track for college preparedness, &/or showing academic improvement
- Climate: Whether students & staff feel a sense of belonging in the school
- Equity: Within the school & compared to other schools, how different student groups are doing across key metrics
For each performance area, we assign one of five ratings:
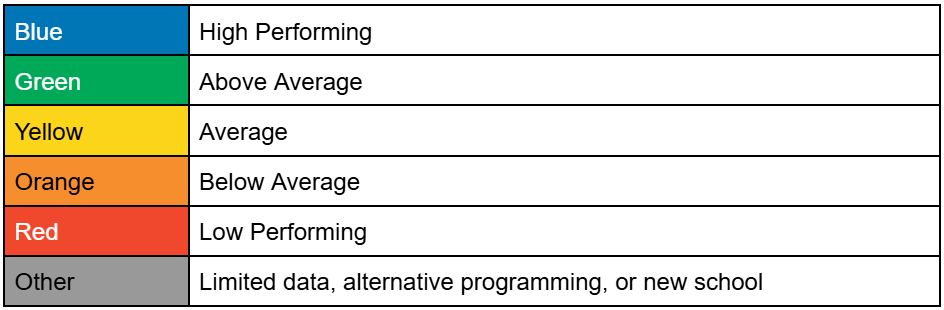
What is the Minneapolis School Finder Rating?
The Minneapolis School Finder Rating (MSFR) helps families understand school data, empowering them to advocate for their children’s success. With 72% of residents supporting a rating that provides clear information about school performance, MSF serves a critical role in our community. Families, school representatives, & community leaders collectively developed this multi-measure definition of school quality. Each eligible school in Minneapolis School Finder (MSF) receives a percentage value. These percentages are divided into color bands with red being the lowest rating a school can receive & blue being the highest. The order of rating the colors is Red, Orange, Yellow, Green, Blue.
The MSFR is not a finished product; this is one attempt to capture a holistic picture of school quality. Education & policy advocates are actively working toward changes in the MSFR by leading work toward improvements in data quality & quantity.
What goes into the Minneapolis School Finder Rating?
The MSFR has three components: Academics, Climate, & Equity. Each component is calculated from different measures that indicate a school’s quality in that area. Rating metrics differ between traditional high schools & schools serving grades K-8.
| Component | K8 Metrics | High School Metrics | Alternative HS Metrics |
| Academic | MCA Proficiency – Math & Reading MCA Progress – Math & Reading | 4 Year Graduation College Continuation Composite ACT | 7 Year Graduation Rate Percent of Grads in College or Working Credit Accumulation |
| Climate | Consistent Attendance Teacher Retention Student Retention | Consistent Attendance Teacher Retention Student Retention | |
| Equity | Intra-school gaps on MCA proficiency, MCA progress, and consistent attendance Inter-school gaps on MCA proficiency, MCA progress, and consistent attendance | Intra-school gaps on graduation rate and consistent attendance Inter-school gaps on graduation rate, student retention, & consistent attendance |
How is the Minneapolis School Finder Rating calculated?
1. Curve each individual measure.
Each measure is divided into 5 color-coded categories, split by 4 cut points. These cut points are curved to fit a flat distribution on a 0 to 100 scale. This allows for comparison across measures.

Reading Proficiency is split into 5 categories. It is then curved to fit a 20/40/60/80 distribution using the formula y = 0.006882×3 – 0.731027×2 + 25.954613 x – 250.46875, where x is the MDE Reported value and y is the SPR Calculated (curved) value.

A school with a Reading Proficiency rate of 37% would be given a curved value of 58%, awarding them a Yellow rating. Each measure has a unique curve based on its designated cut points.
2. Calculate a weighted average for each component.
Building on our previous example, see below for the calculations that go into Example School’s Academic rating.

For K-8 Academics, Math Progress & Reading Progress each make up 37% of the total weight. Math Proficiency and Reading Proficiency make up 13% each.
3. Calculate an Overall Rating using a weighted average of the three components
The same technique is used to award an Overall Rating. That is, the three components contribute to a weighted average, the result of which is the Overall Rating.
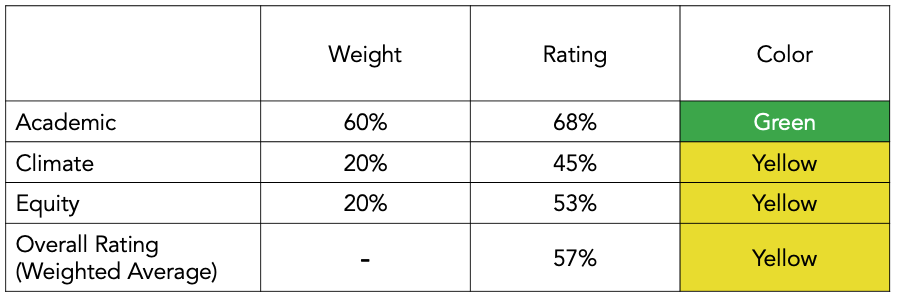
Example School was given a Yellow rating in Climate & a Yellow rating in Equity. These, combined with the Green rating it received in Academic, come to a Yellow overall rating.
Why Does a School Not Have a Rating?
1. Limited Data
The most common reason for a missing rating is the lack of quality data. Schools that were missing data for more than half of their measures were not given a rating. There are several reasons why a school may be missing data.
- For MCA Proficiency, sample size thresholds excluded data for any schools with fewer than 40% of their eligible students taking the MCA in 2025
- For MCA Progress, sample size thresholds excluded data for any schools with fewer than 40% of their eligible students taking the MCA in either 2024 or 2025.
- For Composite ACT, sample size thresholds excluded data for any schools with fewer than 60% of their eligible students taking the ACT in 2024.
- Schools must have valid data for at least half of the metrics in a component to receive a rating.
- Schools must have a rating for all three components to receive an overall rating.
- Independent schools have less publicly available data. While schools were given opportunities to share data, there are still limitations to what is available.
2. New Schools
Schools that opened in the last 3 years have limited data, if they have any data.
3. PreK-2nd Schools
The MCA is administered beginning in Grade 3. This means schools serving only students before Grade 3 will not have Academic data. PreK-2nd schools that are a feeder into 3rd-5th schools are given the Academic rating of their partner school.
4. Alternative Schools
Alternative high schools are high schools that predominantly serve students via credit recovery or dropout recovery. These schools only have Academic ratings. This is because most public climate data is not necessarily indicative of the quality of alternative high schools. For example, for some schools, quality means giving students the flexibility to learn outside of the classroom, thus attendance is not reflective of quality. We are continuing work to expand the availability & quality of Climate metrics to be able to provide a holistic rating to these schools as well.
How can I dive deeper into the calculations?
For more information on how the MSFR is calculated, see the MSFR Calculations Technical Guide.